
In recent years, schools have been collecting increasing amounts of data, creating more opportunities to use it for analysis and planning. According to research published by Gartner, the use of digital analytics tools across primary and secondary education is continuing to grow.
One of the most important approaches to emerge from this trend is data-driven decision-making (DDDM) — making decisions based on evidence from data rather than relying primarily on personal experience, assumptions or intuition.
Imagine, for example, that average test results suddenly fall. An immediate response might be to make the assessment easier. But a closer look at the data may reveal a very different problem: the curriculum may need adjusting, a particular teaching approach may not be working, or a smaller group of students may need additional support.
What data do schools have?
Schools generate information at many different levels.
At classroom level, teachers may work with attendance records, marks, assessment results, curriculum plans, feedback from students and information shared by colleagues. Analysing this data can help a teacher understand the progress of an individual student or identify patterns across a class.
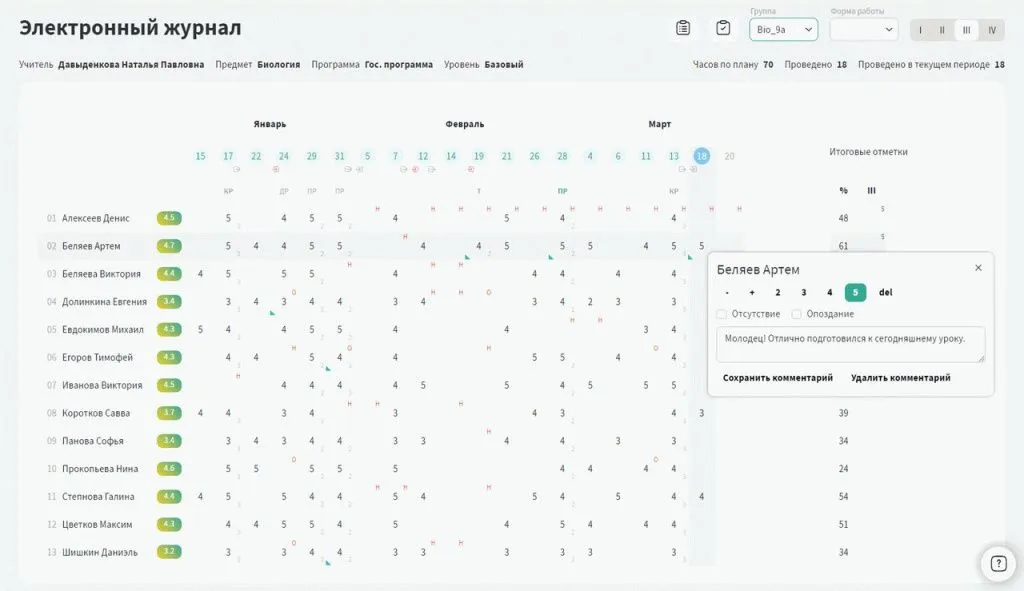
At school level, the volume of information is much greater. It may include academic results, attendance, student demographics, admissions information, behaviour records, wellbeing data, survey responses and operational information collected throughout the year.
Schools may also use information from external sources, such as examination results, parent feedback, inspection or regulatory data and wider education benchmarks.
The important question is not simply how much data a school has, but whether that information is reliable, relevant and useful for making decisions.
Four types of data analytics
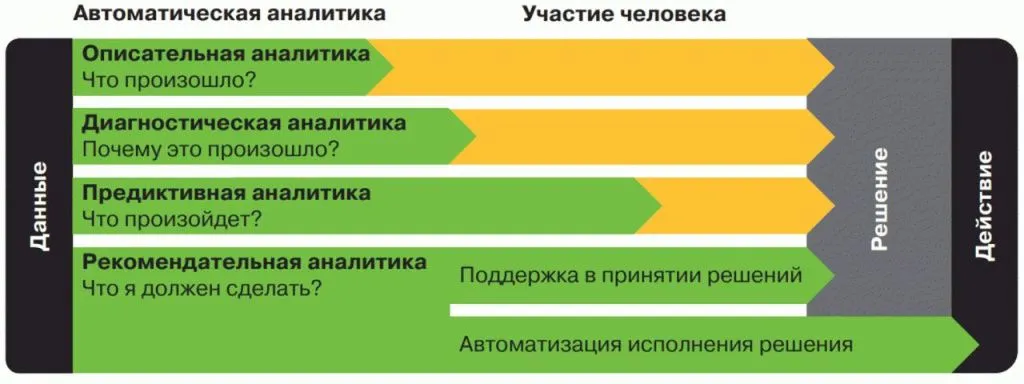
Data can be analysed in different ways depending on the question a school is trying to answer. Analytics is commonly divided into four categories: descriptive, diagnostic, predictive and prescriptive.
Each type moves from understanding what has already happened towards identifying what may happen next and what action could be taken.
Descriptive analytics
Descriptive analytics answers the question: What happened?
It includes information such as attendance reports, assessment results, current attainment, room availability or staffing information.
This is the most familiar form of school analytics: data is collected, organised and presented so that teachers and school leaders can understand the current situation.
Diagnostic analytics
Diagnostic analytics goes a step further and asks: Why did it happen?
For example, a school may divide an English class into two groups and then examine whether the change affected student outcomes. Results can also be compared with external assessments to understand whether an apparent improvement reflects genuine progress.
Predictive analytics
Predictive analytics uses existing data and statistical models to estimate what may happen in the future.
A school might use it to identify students who may be at risk of missing a target, estimate future enrolment or predict how many textbooks and other resources will be needed in the next academic year.
Prescriptive analytics
Prescriptive analytics focuses on the question: What should we do next?
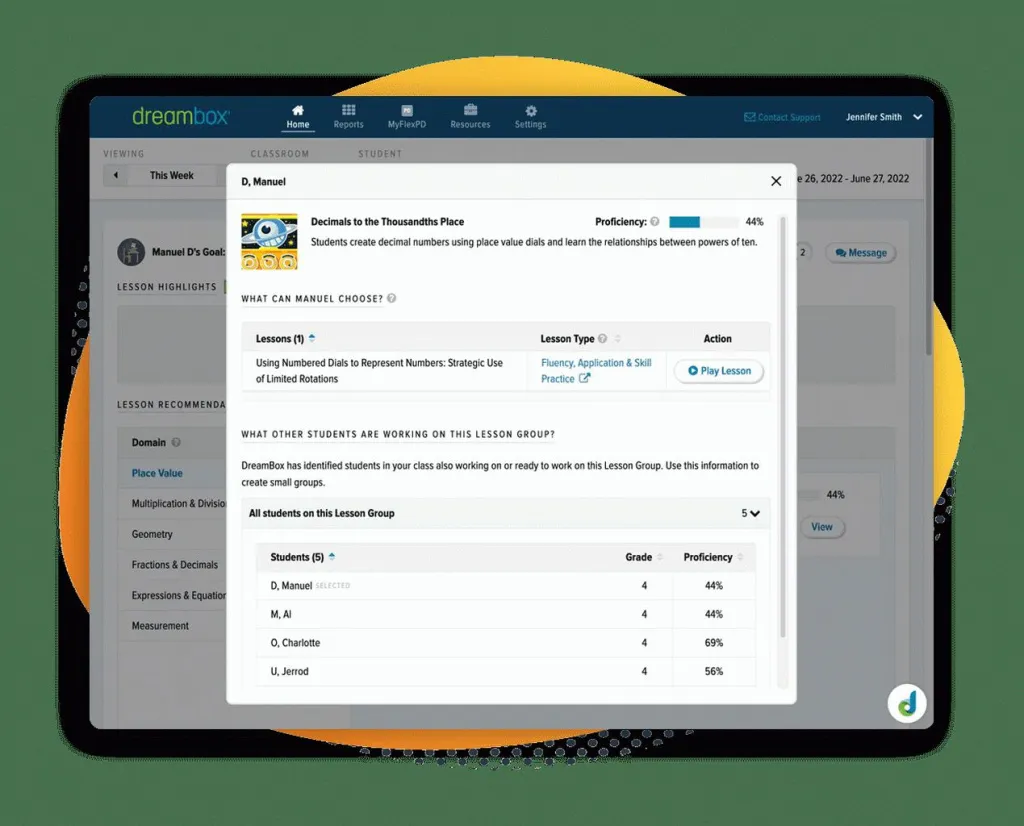
Instead of simply describing or predicting an outcome, the system suggests possible actions. This might include recommending additional learning materials for a student, identifying where staffing may need to increase or suggesting changes to academic provision.
Common challenges with school data
Collecting large amounts of information does not automatically lead to better decisions. Schools often face several practical challenges.
- Data is stored in different systems. Academic records, attendance, admissions, surveys and other information may all be kept in separate platforms. This makes it difficult to build a complete picture without reliable integrations or a central data environment.
- Data quality can vary. Missing, outdated or incorrectly entered information can easily distort analysis and lead to the wrong conclusions.
- Correlation does not always explain causation. A pattern in the data may point to a problem without explaining why it happened.
- Analysis still requires professional judgement. Even sophisticated analytics cannot replace an understanding of the students, teachers and circumstances behind the numbers.

How to become a more data-driven school
Becoming a data-driven school requires more than purchasing analytics software. Schools need reliable information, appropriate tools and staff who understand how to interpret what the data is showing them.
- Understand your data sources. Identify where information comes from and assess whether it is accurate, current and relevant.
- Choose the right tools. Simple analysis may be possible in Excel or Google Sheets, while larger schools may use tools such as Power BI, Tableau or analytics built directly into their school management system.
- Create a reliable data infrastructure. Information should be stored in a consistent format and, where possible, connected across systems so that staff are not constantly exporting and combining separate files.
- Build data literacy across the team. Teachers and school leaders need to understand not only how to access data, but how to interpret it responsibly.
- Use clear visualisation. Charts and dashboards can make trends much easier to understand. A visual view of a student’s attainment over time, for example, can be more useful than a long table of individual marks.
- Use appropriate analytical methods. The method should fit the size and type of the dataset. Techniques designed for very large datasets may not be meaningful when applied to a small class or year group.
- Look for context, not just patterns. A sudden fall in results may have several explanations. Students may have missed part of the assessment, the test may have coincided with another major event, or a particular topic may have been taught differently.
Data is most useful when it leads to better questions and better conversations. It can help schools identify patterns, recognise problems earlier and evaluate whether changes are having the intended effect.
It does not replace teachers, school leaders or professional judgement. Instead, it gives them stronger evidence for understanding what is happening and deciding what to do next.